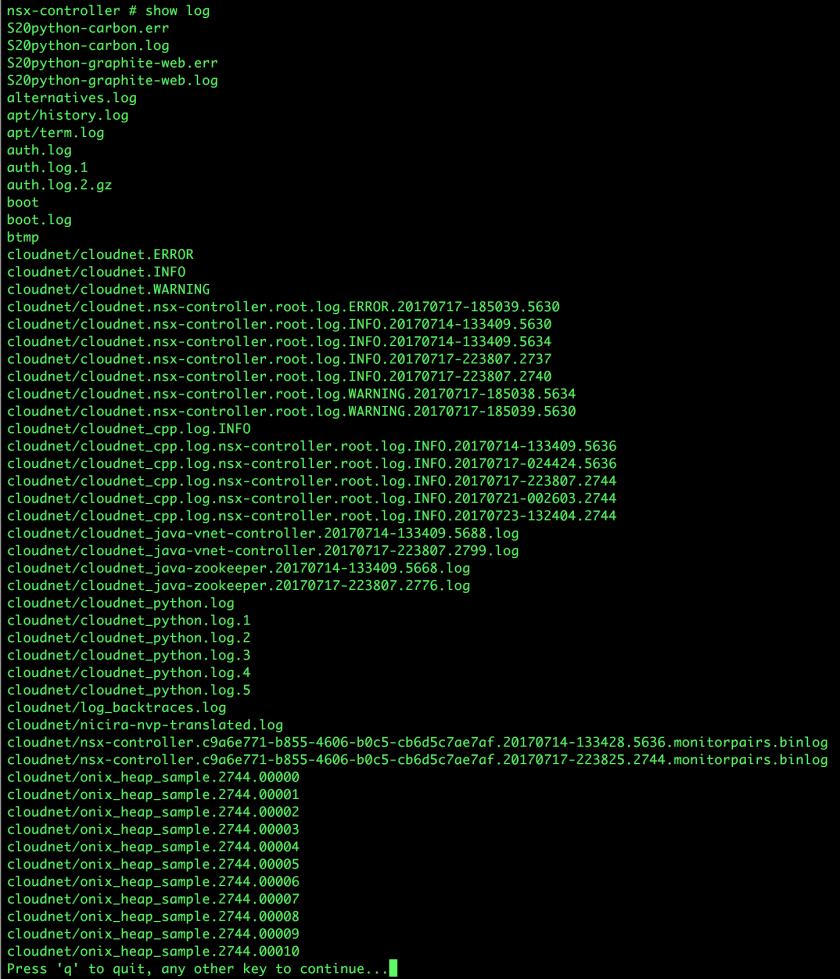
Have you ever wondered what log files matter for day-to-day troubleshooting on the NSX Controller nodes? There are certainly a plethora to choose if you just type show log and press ‘Enter’.
If you haven’t looked at the new VMware Documentation site yes, I encourage you to check it out. There’s a whole new layout. Once you get accustomed to it, I think it’s actually easier than the old web-based documentation.
Anyway, I specifically wanted to call out the NSX CLI Cheat Sheet 1 that’s in the documentation, which walks through common things an NSX Administrator may need to know.
In the Troubleshooting and Operations course, we mention NSX Controller logs a couple of times, and I’d like to expand on that content just a bit.
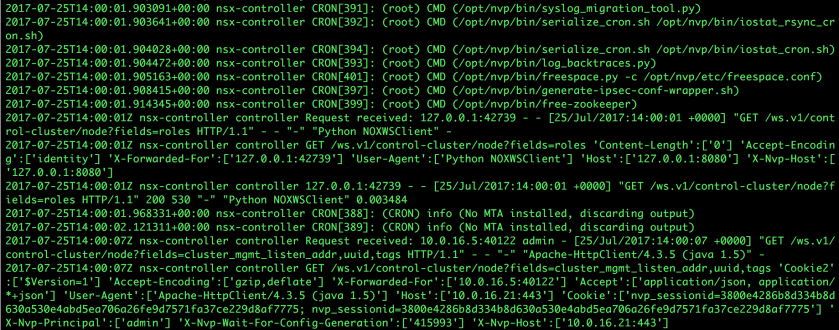
syslog is, well, the core OS system log. Not entirely unlike any other Linux system. In addition to the standard logging content, however, some HTTP access logs are also included.
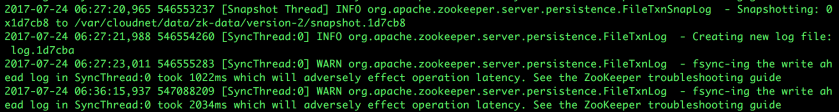
Then, there’s the Zookeeper log (cloudnet/cloudnet\_java-zookeeper<timestamp>.log). This log contains the logged data related to the Zookeeper process that enables NSX Controller Clustering. Some things you may see in this log are disk latency warnings, that could indicate issues with Controller syncing:
Finally, we have the core NSX Controller log file, cloudnet/cloudnet.nsx-controller.root.log.INFO.<timestamp>. This file contains a wealth of information about the operation of the NSX Controller. Let’s look at some of these messages individually.
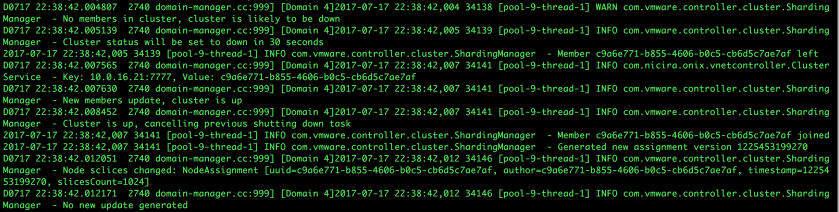
What we’re seeing in the above screenshot is an issue with the Controller cluster. Fortunately, it’s very short-lived and does not trigger a control plane issue. The Controller Cluster can’t find any functional nodes, so it announces that the cluster will shut down in 30 seconds. This will trigger all connections to this surviving node to drop, causing a control plane outage. A cluster member, however, joined before the 30 second timer completed. The cluster shutdown is aborted, and the Sharding Manager is invoked to distributed slices to the new cluster member.
The next image simply shows us a VTEP Leave Report being acted upon by the Controller:

Here’s an interesting one:

What we see here is that a host sent a VTEP Join Report to the Controller, but the VTEP was already joined to the VNI. If we look carefully, we see that the existing VTEP Join Report came across Connection ID 7 (connId=7), while the new, conflicting report came across Connection ID 8. Also worth noting here is that the control plane sync state for the original VTEP Report was good (isOutOfSync=False), where the new connection has not yet resynchronized its control plane (isOutOfSync=True).
And have you ever wondered about hosts sending ARP information for VMs after the VM has been identified? Take a look at this:

There’s a lot to look at when you get into log analysis, but once you can narrow down the important files, interpreting them is actually pretty straightforward.
